The 3 GB memory leak that wasn't in the heap
The 3 GB memory leak that wasn't in the heap
Linkgo's hosting bill was $39.28 a month, and 87% of it was memory. Total CPU for the same period was $0.48. We were not paying for work — we were paying for a web service that started each deploy at 0.297 GB and climbed to 3.0–3.24 GB over about seven days, then sat there until the next deploy reset it.
The problem
The shape was the suspicious part. The database service held flat at 0.16–0.20 GB across the same window. Our AI worker held at 0.36–0.63 GB. Only the Next.js web service ratcheted, and it ratcheted monotonically — no sawtooth, no recovery, just up and then a plateau.
That is what a retention leak looks like, so we treated it as one. Node was running with no --max-old-space-size, which on this container means V8 will happily reserve up to 4,144 MB. Cap the ceiling, we reasoned, and either the ratchet stops or the process OOMs and tells us where the leak is.
We shipped --max-old-space-size=384 alongside two other cost fixes: a startup gate in front of five in-process schedulers that allocated hourly regardless of traffic, and revalidate = 3600 on six sitemap routes that had been fully dynamic. Linkgo gets about six human sessions a day and roughly 29,000 bot requests a day, and every crawler hit was re-running a full table scan (the FAQ sitemap alone walks 3,362 rows).
The heap cap appeared to work. RSS dropped from 3.2 GB to 1.6 GB. We nearly closed the ticket there.
Why it happened
We didn't close it, because "appeared to work" is not a measurement. We added a temporary memory breakdown to /api/health that split RSS into its segments: heapUsed, external, arrayBuffers, and unaccounted — everything V8 knows nothing about.
It answered in 1.4 hours.
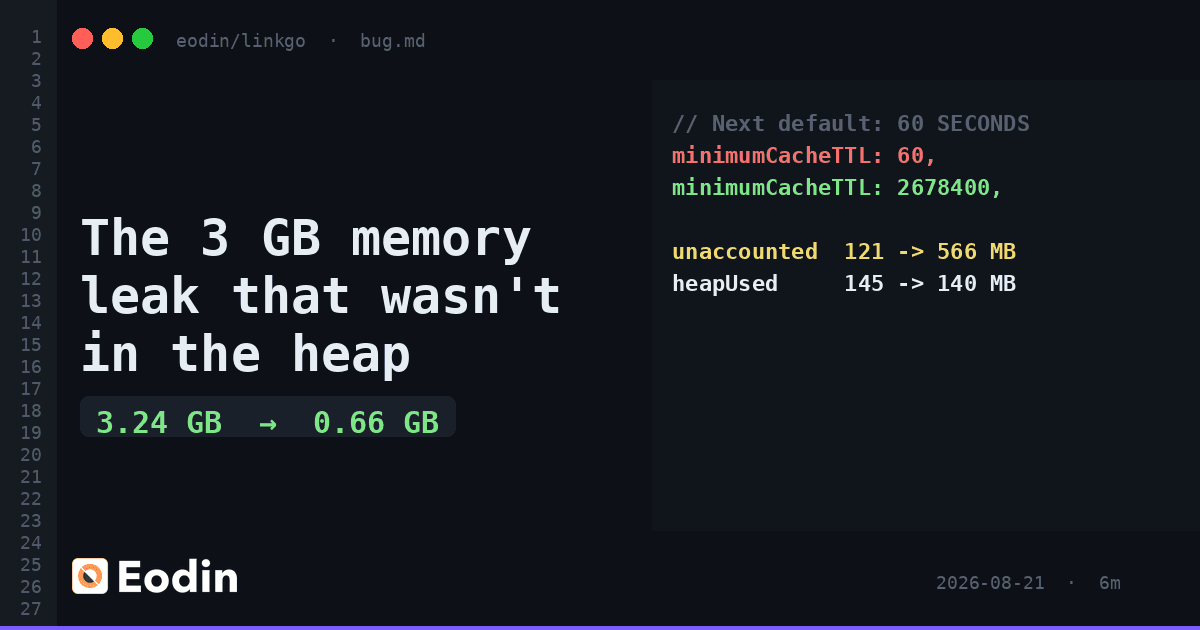
unaccounted   121 MB → 566 MB   (+314 MB/h)
heapUsed      145 MB → 140 MB   (fell)
external        +0.2 MB
arrayBuffers    +0.0 MB
98% of the growth was native memory outside V8's world. There was no JS retention leak. --max-old-space-size had never been able to touch this — the 3.2 GB → 1.6 GB it looked like it delivered was just V8 declining to reserve as much against a lower ceiling. We had "fixed" the number we were reading, not the thing producing it.
Native allocation in a Next.js server has one obvious suspect: sharp, and underneath it libvips, which allocates memory glibc holds in its arenas rather than returning to the OS. And the platform bills RSS.
We reproduced it locally before changing anything. 120 requests to /_next/image across 40 distinct 2000×2000 sources took RSS from 182 MB to 920 MB while heapUsed fell.
The mechanism turned out to be a framework default. Next's minimumCacheTTL is 60 seconds. An optimized image is X-Nextjs-Cache: HIT immediately after it's produced and STALE 65 seconds later, so sharp re-encodes it on the next request — forever. The same 60 seconds also goes out as Cache-Control: max-age=60, so crawlers re-fetch on that cycle too. With bots continuously walking 1,063 tool pages, that is a permanent, unending encode workload.
What we tried first
Two other explanations were plausible enough that we measured them instead of shipping on a hunch. Both were wrong:
- AVIF is expensive, drop it. WebP-only cost +317 MB over 80 requests. AVIF cost +308 MB. Not it.
sharp's cache and thread pool are hoarding.cache(false)plusconcurrency(1)gave +644 MB against a +717 MB baseline. That's noise, not a fix.
Recording the rejected hypotheses with their numbers took an extra afternoon and saved the next person from re-walking both.
The fix
Two lines of config, heavily commented so nobody "cleans them up" later:
images: {
  formats: ['image/webp', 'image/avif'],
  // Next's default is 60 SECONDS: an optimized image goes STALE one minute
  // after it is produced, so sharp re-encodes it on the next request, forever.
  minimumCacheTTL: 2678400, // 31 days
  // Default tops out at 3840. ToolCard renders its logo with `fill`, and for a
  // fill image Next points plain `src` at the LARGEST deviceSize -- so every
  // crawler ignoring srcset pulled the 4K variant.
  deviceSizes: [640, 750, 828, 1080, 1200, 1920],
},
A long TTL is safe here because a changed logo arrives as a new upstream URL — a different cache key — so a stale variant can't be served for art that changed. The deviceSizes cap matters more than it looks: measured per encode, a variant costs 5.3 MB at w=640, 16.9 MB at w=1920, and 18.0 MB at w=3840. Nothing on the site renders above a 16:10 card thumbnail in a three-column grid.
We held one more change back, MALLOC_ARENA_MAX=2, to a separate deploy so its effect on the remaining cold-encode cost stayed attributable to it.
Before and after
With the TTL fix in, three further identical 120-request passes moved RSS 951 → 951 → 954 MB, and ran in 0 seconds instead of 8 — sharp simply doesn't run. A fourth pass 70 seconds later still didn't re-encode. Growth became strictly one-time per variant, bounded by the variant universe.
Then we got the verdict wrong twice.
At 5 hours of uptime we called it: 394 MB, post-warmup slope −14 MB/h, cost $7.20/mo. At 8.5 hours we retracted that, because the window showed +21 MB/h and the ratchet looked alive again. Only with 35.7 hours of continuous data did the picture resolve: past the first ~12 hours, first-half mean 573.5 MB against second-half mean 575.2 MB — 1.7 MB of drift across half a day.
Both early readings had been taken inside the ramp-up. Fitting a slope across a ramp reports the ramp.
The final number, with 64 hours of data and five consecutive twelve-hour block means agreeing inside 671–682 MB: the service settles at 0.662 GB and the bill is $10.72/mo, down from $39.28. That is a 73% cut, and it misses our own $10 target by $0.72 — which is why the encode path is now off entirely (images.unoptimized: true), removing the floor rather than shaving it.
What we learned
heapUsedis not RSS, and on a container you are billed for RSS. If the two disagree, instrument the gap before you tune the heap. A heap flag that "works" may just be changing what V8 reserves.- Don't fit a trend until the transient has ended. The rule we first wrote down was "sample longer than the event spacing," and that was wrong too. You only know a ramp has ended by watching past it — in practice, wait until consecutive block means agree.
- That rule applies to every summary statistic, not just slopes. Our $9.2/mo figure was a mean computed inside the ramp, by the same people who had just written down not to do that with slopes. It was off by 16%.
- Framework defaults are tuned for someone else's traffic. A 60-second image cache is reasonable for a site serving humans. For 1,063 pages being continuously crawled by bots, it's an infinite loop with a bill attached.
What's next
We don't yet know where the memory plateau lands with the encode path removed — and we're not going to claim a new cost number until consecutive block means agree, which is roughly two days of data, not five hours. The minimumCacheTTL and deviceSizes settings stay in the config, inert but commented, because they're the correct fix if optimization ever comes back.
Try Linkgo
Linkgo is a curated directory of AI tools, agents, MCPs, and models — browse the catalog at linkgo.dev.
Frequently Asked Questions
What caused the apparent 3 GB memory leak in the Next.js web service?
The memory growth was due to native memory allocations outside V8's heap, primarily from the image processing library sharp and its underlying libvips. The default 60-second cache TTL caused continuous re-encoding of images on each request, especially under heavy bot traffic, leading to high RSS memory usage.
Why didn't setting --max-old-space-size fix the memory leak?
The --max-old-space-size flag limits V8's JavaScript heap size but does not affect native memory allocations like those from sharp/libvips. The observed memory growth was mostly in native memory, so capping the heap only reduced V8's reserved space without addressing the actual leak.
How was the memory leak ultimately fixed in the Next.js configuration?
The fix involved increasing the minimumCacheTTL from 60 seconds to 31 days to prevent frequent image re-encodes, and capping deviceSizes to limit large image variants. This stopped sharp from repeatedly encoding images on every request, drastically reducing native memory growth.
What lessons were learned about measuring memory leaks from this case?
Key lessons include distinguishing between heapUsed and RSS memory, as billing is based on RSS; avoiding premature conclusions by sampling memory over sufficient time to pass transient ramps; and recognizing that framework defaults may not suit all traffic patterns, especially heavy bot crawling.
Why is it important to monitor native memory usage separately from V8 heap in Node.js applications?
Because native memory allocations, such as those by image processing libraries, are not tracked by V8 and can cause significant memory growth unnoticed by heap metrics. Monitoring both ensures accurate diagnosis of memory issues and prevents misattributing leaks solely to JavaScript heap retention.
Continue reading
The accessible button that screen readers couldn't press
Semantics(excludeSemantics: true) dropped our InkWell's tap action, so TalkBack announced a button it could not press. What we measured and fixed.
The 57pt layout jump that moved a button mid-tap
A background query finished and Cubist's primary button slid 57pt up the screen. The three-line fix was easy; getting a test to see it was not.

How we cut public-page transfer 57% by deleting our bundle config
A webpack splitChunks block named "bundle optimization" was disabling Next.js per-route splitting and shipping admin-only libraries to 1,078 public pages.